
Critical Power and W’ Explained [inc. CP Calculator]
Most cyclists are familiar with the concept of Functional Threshold Power (FTP). However, comparatively few know about or understand ‘critical power’, despite it being commonly used and preferred by many exercise physiologists and several cycling federations.
We believe that critical power testing can be used as a better alternative to FTP testing, offering several benefits and being based upon more robust scientific concepts.
In this article, we’ll be looking at what critical power is, why you might want to use it, and how to go about performing accurate testing.
If you’re looking to simply calculate your critical power and W’, click here to use our advanced Critical Power and W’ Calculator.
What’s Critical Power?
Critical power derives from the concept that the power-duration relationship above a certain ‘critical power’ follows a well-defined hyperbolic curve as shown:
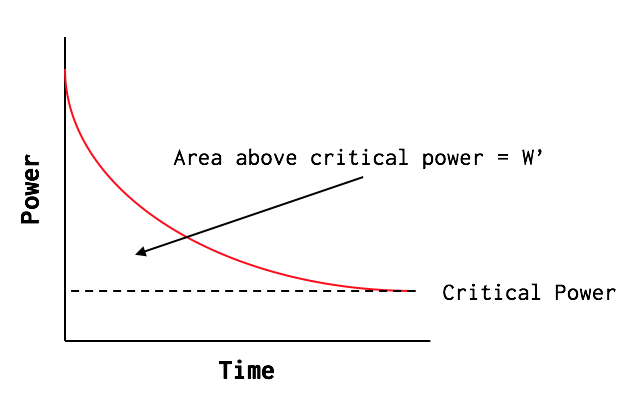
The curve can be defined by two parameters: the critical power (CP) and W’ (pronounced as ‘W prime’). We’ll take a look at each of these in turn:
Critical Power
CP is the power output that you’ll trend towards when riding at a high intensity, as exercise duration is increased ‘indefinitely’. ‘Indefinitely’ is a mathematical construct, and not actually true in practice, which is why this power-duration model fails to hold at or below CP. In practice, people can typically only sustain power outputs at CP for around 30-minutes (Vanhatalo et al., 2011).
Whilst it’s been shown that CP occurs close to the maximal lactate steady state (Poole et al., 2016), in most cases CP should not be used as a direct replacement for FTP (Karsten et al., 2021), which admittedly limits it’s direct application given almost all commercially available training platforms use FTP as their central power-based value to calculate intensity factor, training stress etc.
That said, we’ve found that taking around 96% of critical power as an FTP estimate generally works quite well for most individuals, especially if you also use your own subjective sensations to iterate your FTP and training intensity targets further (see e.g. this article).
W’
W’ (measured in kJ – i.e. units of energy) is the amount of work that can be done above the CP. It is a function of the VO2 slow component, VO2max, the depletion of limited intramuscular substrates (i.e. muscle PCr and glycogen) and the associated accumulation of fatigue-related metabolites, such as hydrogen ions, adenosine diphosphate (ADP) and and phosphate ions (Pi); each of which has been associated with impaired muscle contractile function (Poole et al., 2016).
W’ can vary widely. Endurance athletes will generally have a W’ that’s between around 9-15kJ for men, and between around 6-10kJ for women, although these values can be bigger for athletes with a very high VO2max. For more punchy endurance disciplines, slightly higher W’ are better suited – such as between 15-18kJ for men, or 11-13kJ for women. At the other end of the spectrum, sprinters can have W’ values in excess of 25-30kJ (Vanhatalo et al., 2011).
By performing a series of maximal efforts, each lasting somewhere between 3-mins and 20-mins, it’s possible to plot the relationship between CP and W’ and determine the values of these parameters.
Why Test CP and W’?
The obvious benefit of critical power testing is that it gives you two physiological markers from one test: critical power and W’. As the lactate threshold is a balance between the aerobic and anaerobic systems, knowing both CP and W’ can be useful in determining how best to balance these different parts of your physiology (read more on this here).
CP can also work better than FTP for setting training zones if you’re anaerobically stronger or weaker than the ‘norm’. That’s because common FTP test protocols (such as the 20-min test and the ramp/step test seen in popular indoor training platforms like Zwift and TrainerRoad) make assumptions about the extent to which the anaerobic energy systems contribute during the test, and can sometimes produce FTP estimates that are out by as much as 10-15%.
In contrast, the CP model inherently takes into account the amount of energy available over this threshold, and thus can produce better estimates of your maximal sustainable power if you happen to be notably anaerobically strong or weak.
Another significant benefit is that once you know your CP and W’, you can use the critical power equation (below) to predict the maximal power you could hold over various durations, or the length of time you could hold a given power (for durations between around 3 to 30-minutes). So, it can be useful for creating pacing strategies for measured efforts like hills climbs and time trials.
In the next section, we’ll look at how CP and W’ can be calculated. It’s not essential to understand the critical power calculations in detail, so you can skip over the next section if you wish. However, we’ve included the maths for those who are interested.
Calculating CP and W’
There are a range of methods for determining CP and W’, with varying levels of complexity and no accepted ‘gold standard’ approach (Maturana et al., 2018).
In our view, the most practical and easily-accessible approach is one where the power-duration relationship is transformed into a linear relationship, by plotting power against 1/time, as shown below.

For those who are mathematically minded, the equation relating power and time then becomes:
Power = W’/Time + CP
By completing a series of maximal efforts, we can plot this linear power-duration relationship to determine W’ and CP, where CP is the y-intercept, and W’ is the gradient.
Several studies have proposed that CP and W’ can be determined from just two maximal efforts (Maturana et al., 2018; Simpson & Kordi., 2017). However, in our experience, using just two maximal efforts is highly sensitive to the specific powers and/or test durations used (making repeat tests hard to compare) and can result in fairly inaccurate estimates under certain circumstances. So, we recommend using 3-4 maximal tests to calculate CP and W’ accurately.
Let’s now look at how you can determine CP and W’ in practice.
Testing Protocols
In order to determine CP and W’, you will need to complete 3-4 maximal efforts, each lasting between 3-mins and 20-mins.
To get a good spread of durations, we’d recommend tests lasting 3-mins, 5-mins, and 12-mins, with the optional addition of a 20-min test.
The optional fourth test will help improve the accuracy of your results. The 5-min and 20-min test results can also be used to cross-reference your data with a power profile chart (see here), plus you can also cross-reference your CP with your FTP, as calculated from the 20-min test (see here).
Each maximal effort should be paced as consistently as possible. So, don’t start too hard, and then fade towards the end.
The tests should be performed on different days, with at least 24H rest between, so that your results aren’t impacted by fatigue. Completing multiple tests in the same day will tend to under-estimate your W’ value, because the W’ may not be fully reconstituted by the time you begin the second test effort.
Make sure you warm up well before each maximal effort. This is important because one of the assumptions of the critical power model is that the aerobic systems kick in instantaneously to provide energy during each maximal effort.
In practice this isn’t true, and there’s a lag between the effort starting, and the aerobic systems ramping up their energy contribution. However, this lag can be minimised by warming up well beforehand. Research looking at oxygen uptake after a warm-up (Jones et al., 2003) suggests a good warm-up should include:
a gradual increase in exercise intensity from around a 2/10 to a 4/10 effort level or from around 45% to 75% FTP/CP/lactate threshold power.
then some hard efforts above your expected FTP/CP/lactate threshold power, where you should feel lactate levels building somewhat, but these efforts these should only feel moderately hard, not all-out.
then finally a short period (e.g. 4-5 mins) of gentle riding around a 2-3/10 effort level or between around 45-55% FTP to allow lactate levels to reduce.
CP Calculator
Input your test results in this section. Make sure you enter duration in seconds, and not in minutes!
If you only did two tests, then just enter results for Test 1 and Test 2.
Results - Two Test Solution
Results - Three Test Solution
Pacing Calculator
Testing Tips
Keep things consistent. Both our own experience and data from scientific studies shows that the length of the testing intervals can have a notable impact on your CP and W’ estimates (Maturana et al., 2018). So, if you’re trying to track changes over time, try to keep the length of the test intervals consistent each time you test.
Be cautious when interpreting your results the first two times you determine your CP and W’, as these results will likely be less reliable due to sub-optimal pacing. Research shows that results become more reliable once you’ve completed the testing protocol at least three times (Simpson & Kordi, 2017).
Potential Limitations
Finally, to wrap-up this article, we should consider whether there are any limitations to critical power testing.
It’s worth mentioning firstly that like any field-based testing that demands maximal efforts to be produced, the results are highly sensitive to factors such as fatigue, motivation, nutrition and environmental conditions, which can influence performance on the day. There will ALWAYS be day-to-day differences in performance and your associated CP and W’ values. Try your best to control these confounding factors as much as possible.
We’ve already mentioned above that the test results are sensitive to testing durations and will be less reliable if you’re inexperienced with these test durations. But again, this is true of other field-based testing methods, such as the various protocols for determining FTP.
Ultimately, we think that critical power testing is one of the best field-based testing options, which can give more valuable physiological information that basic FTP testing, and which can be more accurate for athletes with notably high/low anaerobic capacities.
Get Fast, Faster:

Free Workout Guide
Get our popular Key Workouts Guide; a free collection of 10 essential workouts you can use today to begin improving your endurance, threshold power, VO2max and other vital cycling abilities.
References
Jones, A. M., Koppo, K., & Burnley, M. (2003). Effects of prior exercise on metabolic and gas exchange responses to exercise. Sports Medicine, 33(13), 949-971.
Karsten, B., Petrigna, L., Klose, A., Bianco, A., Townsend, N., & Triska, C. (2020). Relationship Between the Critical Power Test and a 20-min Functional Threshold Power Test in Cycling. Frontiers in Physiology, 11.
Maturana, F. M., Fontana, F. Y., Pogliaghi, S., Passfield, L., & Murias, J. M. (2018). Critical power: How different protocols and models affect its determination. Journal of Science and Medicine in Sport, 21(7), 742-747.
Poole, D. C., Burnley, M., Vanhatalo, A., Rossiter, H. B., & Jones, A. M. (2016). Critical power: an important fatigue threshold in exercise physiology. Medicine and science in sports and exercise, 48(11), 2320.
Simpson, L., & Kordi, M. (2017). Comparison of Critical Power and W′ Derived From 2 or 3 Maximal Tests, International Journal of Sports Physiology and Performance, 12(6), 825-830.
Vanhatalo, A., Jones, A. M., & Burnley, M. (2011). Application of critical power in sport. International journal of sports physiology and performance, 6(1), 128-136.