
Individualising Your Training Zones: 6 Effective Methods
In order to bring about specific training adaptations, training intensities need to be in the correct zone.
For example, in order to reduce the production of lactate and associated metabolites that have been linked with fatigue, we are typically looking to train at an intensity that maximises the rate of fat oxidation. Likewise, if we are trying to improve aerobic capacity (VO2max), we often want to work at an intensity that’s hard enough to elicit close to the maximal rate of oxygen consumption, but that’s also easy enough that we can keep training at this intensity for a reasonable length of time.
There are several classic training zone systems. An example based on Andrew Coggan’s training zones is set out below. All such training zone systems are derived as a percentage of a single physiological parameter such as FTP, VO2max, or threshold/maximum heart rate.

However, while these models hold true on average, a limitation of using a single physiological parameter to set training zones is that they are not appropriate for everyone. So, to optimise your training, it’s best to individualise your training zones. Here are six ways we do this at High North Performance:
1. Self-Paced Efforts
One thing we do with many of our athletes is to ask them to complete a self-paced test. So, for example, we might ask our clients to do a ‘classic’ VO2max workout consisting of 6x 3-mins, with 3-mins recovery.
This should be done without looking at power, but aiming to pace these efforts consistently, so that the overall session feels like 8 out of 10 in terms of difficulty (i.e. the last interval feels hard to complete, but is not pushing you right to the limit like you would in a race).
Power should be recorded throughout, and from this we can see what power was actually hit, and can adjust the power targets for subsequent intervals accordingly. For example, if the client manages to maintain 130% FTP during the set of VO2max intervals, then we know we need to increase the power target from the ‘norm’ for these efforts.
2. Power Profile Testing
Alongside self-paced tests, we also regularly ask our athletes to complete a power profile test, which helps us to understand the athlete’s strengths and weaknesses across the full spectrum of powers. This can involve completing all-out (but consistently paced) efforts lasting 5-secs, 1-min, 5-mins and 20-mins, for example.
The average power produced across each effort can be normalised to body weight (i.e. converted to W/kg) and compared to a power profile chart (e.g. the one below from Andy Coggan) to identify strengths and weaknesses. The power achieved across these durations provide crude indicators of neuromuscular power, anaerobic capacity, aerobic capacity, and lactate threshold (‘FT’ in chart below) respectively (where lactate threshold is commonly estimated as 95% 20-min power).
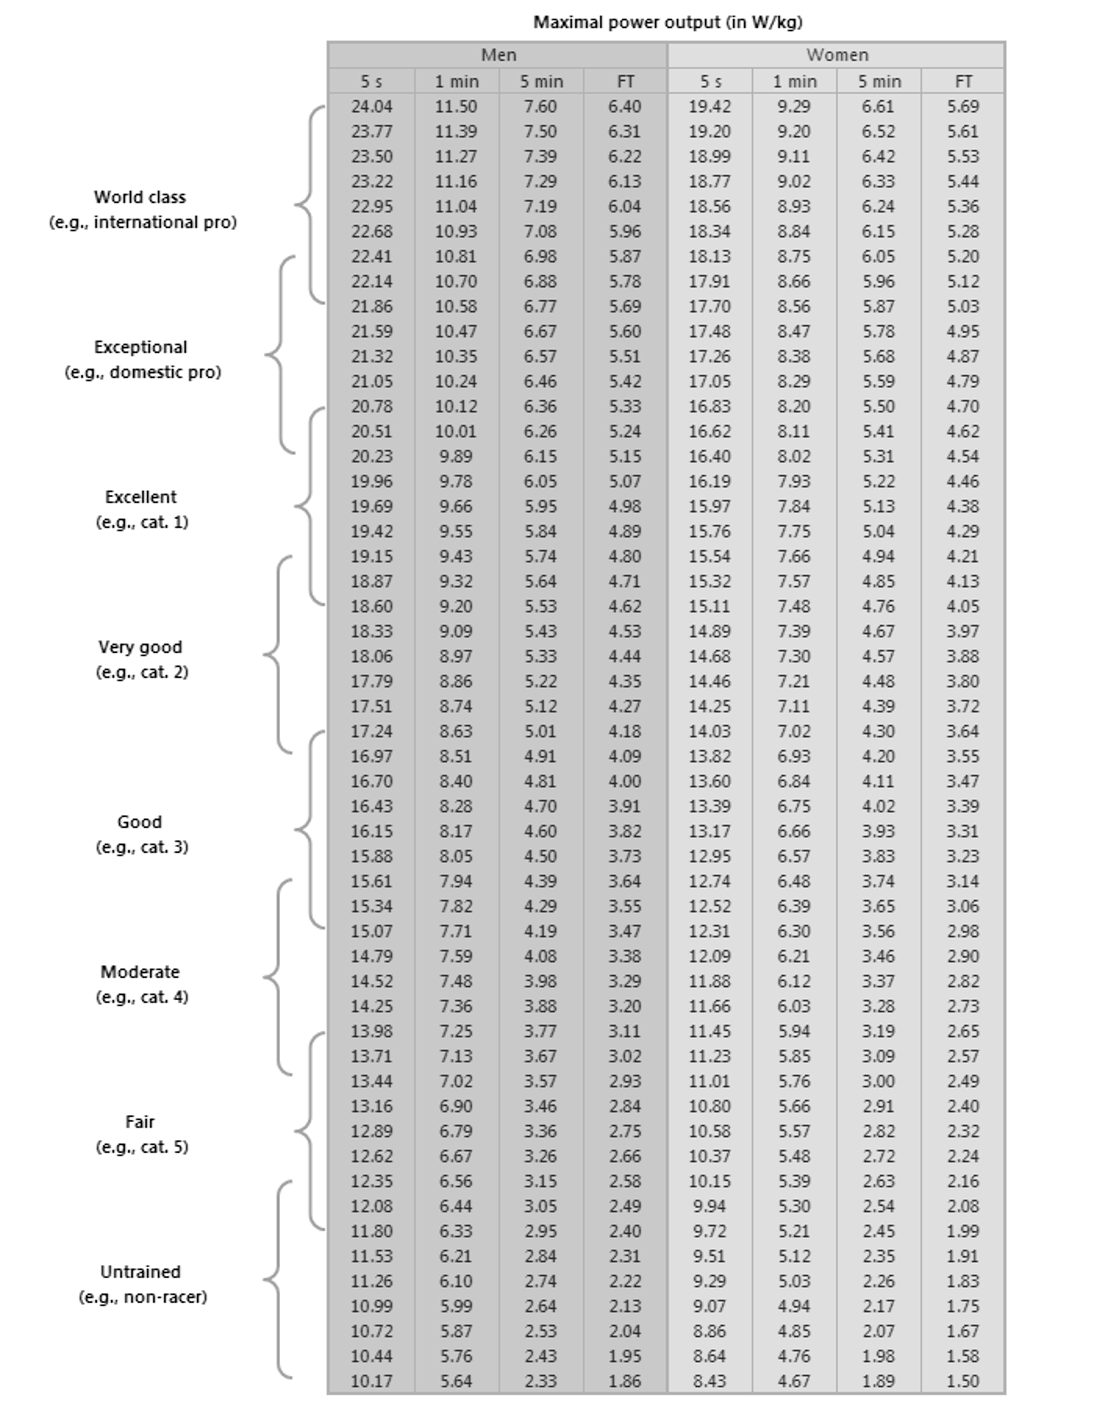
Table taken from Training and Racing with a Power Meter by Andrew Coggan & Hunter Allen.
If we find an athlete is, for example, notably stronger over 20-minutes compared to 1-min (e.g. they might be rated as having a ‘good’ lactate threshold, but only a ‘fair’ power over 1-min), then we know we probably need to reduce the standard power target for anaerobic intervals.
Another similar method involves performing critical power testing. A full discussion of critical power testing is beyond the scope of this article, but you can read about it here. In short, can provide insight into the balance between an athlete’s aerobic and anaerobic capabilities, and gives us an idea of how we might need to adjust training intensity targets. For example, an athlete with a low W’ (i.e. capacity to ride above their threshold power) will probably need their power targets revising downwards for any efforts above the threshold.
3. Checking Heart Rate
This tip specifically relates to intervals targeting improvements in VO2max (i.e. ‘aerobic capacity’). That’s because oxygen consumption tracks approximately linearly with heart rate, meaning you can use heart rate as an indicator of whether you are working at or close to VO2max.
So, when doing VO2max intervals, we’re often looking for heart rate to get up to 90-95% of your max heart rate, indicating that you are working very close to VO2max.
The heart rate can take some time to rise (in much the same way that oxygen consumption does), so we often don’t see heart rate get up to the 90-95% range for a minute or two. That’s normal, and doesn’t mean you’re not working at the right intensity initially.
By checking heart rate, you can also experiment with interval designs that help you to score more time within the target heart rate zone. These might include intervals that start harder and then ease off a bit, allowing your heart rate to rise more rapidly and then stay elevated for the remainder of the interval. They might also include ‘microburst’ intervals (e.g. 30S on, 15S off), which allow you to hold your heart rate at a high value for an extended period.
Of course, to use this heart rate technique, you need to have a good idea of what your max heart rate is. The often-cited equation of 220 minus your age doesn’t work too well at the individual level, so the best approach is to look back at your historical heart rate data to identify your max. You would typically hit your max heart rate during a hard race (a sprint at the end of a race is a particularly good place to look) or during a really hard effort in training. If you’ve done a VO2max ramp test in a lab, you could also take your max heart rate from this.
It is also worth noting that heart rate can be affected by lots of things, such as fatigue, fuelling, hydration, stress levels, hormones, environment… the list goes on. So, we’d never recommend adjusting your power targets based on one session in isolation, as this might just be an anomaly. Ideally you need to repeat the session a few times, and see how your heart rate looks on average.
4. Assessing Perceived Exertion
One thing it’s also good to stay aware of is perceived exertion. This is a good common-sense cross-check that the intervals are at the right intensity. In general, we’re aiming for effort levels of:
Recovery: 1-3/10
Endurance: 4-5/10
Tempo: 6/10
Threshold: 7/10
VO2max: 8/10
Anaerobic: 9/10
Bear in mind though, that you can feel different from day to day, so again, you’d ideally need to repeat the session a few times, and see how you feel on average.
If you use a platform like TrainingPeaks, you can rate how hard you found each session overall, and also leave a note for yourself on how hard you felt the intervals themselves were, so that you can keep an eye on this.
5. Use of modelling software e.g. WKO5
A further way of individualising your training zones, is to use modelling software such as WKO5. This method is effectively a more advanced version of power profile testing, where rather than looking at your power across four key durations, the software produces a model of your maximal power across a spectrum of durations, from 1 second right up to several hours (known as your ‘power-duration curve’), based on data from a number of maximal efforts. This in turn can be used to derive individualised training zones (referred to as ‘ilevels’ in WKO5) from your own unique power-duration curve.
Key to this method though is that you must have recent maximal power data across a range of durations in order for the power-duration curve to be correct. If you just go out and ride your regular training rides, without doing some dedicated maximal efforts, your power-duration curve will not be correct, and nor will your individualised training zones. Maximal efforts also need to be completed fairly regularly to capture changes in your power-duration curve as your fitness changes. As a default, the model only uses data up to 90 days old, so you must have maximal data within the last 90 days as a minimum.
The maximal data must also be reliable, so it’s important to check your power data and correct any anomalies.
We have good experience interpreting the data from WKO5 and assessing whether the data are reliable. So, if this is something you’d like to incorporate into your training, let us know.
6. Lab Testing
Broadly speaking, lab testing is the gold standard for establishing training zones, and can include a variety of testing methods and protocols, including lactate testing, measurement of expired gas (this measures the amount of oxygen and carbon dioxide in the air you breathe, which can tell you about substrate utilisation and your rate of oxygen use i.e. ‘VO2’), measurement of muscle oxygen saturation in muscle capillaries (which can give information on any bottlenecks in oxygen supply and utilisation).
We can help with identifying the most appropriate lab testing for you, or with analysing any lab testing data you already have. Get in touch via our consultation page, if this is of interest.
Summary
Hopefully that’s given you an overview of how you – either on your own or with the support of a coach – might be able to individualise your training zones. The best approach is to try to combine as many of these techniques as possible, as each provides additional and useful information that can help you to develop a comprehensive picture of how you respond to different types of training.
-
To pick up our free Key Workouts Guide, featuring 10 effective sessions designed to stimulate adaptations in the major physiological domains that determine successful cycling performance, click here: