
Cycling Power Profiling Explained
For cyclists looking for a step-up from FTP testing, then power profiling is one option to glean more insight about your strengths and weaknesses as a rider, and how your fitness is changing over time.
Although FTP tends to correlate with endurance cycling performance and is a useful fitness parameter to track, in reality it tells us relatively little about the type of rider you are, and how your fitness is changing over time. For example, we have no idea whether an increase in FTP is caused by an improvement in VO2max, better fat oxidation, or something else entirely. Nor do we have any information on how things like sprint power or longer-duration endurance are changing.
Power profile testing is one method to overcome some of these FTP limitations. The basic premise is that we look at how maximal power varies over different durations. Is your 1-min power very strong relative to your 20-minute power, for example?
Knowing your overall power profile in cycling - also known as your power-duration curve - can help you to understand:
The type of rider you are, and the types of events that suit you most,
The types of training you should focus on,
Whether your training is having the desired effect,
How to individualise your training intensity targets to suit your specific physiology.
In this article, we’ll take a detailed look at power profiling, understanding the various methods that can be used, how to interpret and use real-world power profile data, as well as covering some protocols and tips for getting the most from this testing method.
Original Power Profile Testing Method
One of the oldest iterations of power profile testing in cycling - and one that’s still used widely today - is the system developed by Andrew Coggan.
Coggan proposed that the maximal power of a cyclist over 5-seconds, 1-minute, 5-minutes, and at FTP could be taken to represent an athlete’s neuromuscular power, anaerobic capacity, VO2max, and threshold power respectively. In essence, these 4 key durations help to understand some key performance-related attributes of a rider.
Coggan also derived a table of reference values against which athletes can compare, with powers expressed as watts/kg. This table is shown below:

Table taken from Training and Racing with a Power Meter by Andrew Coggan & Hunter Allen (copyright VeloPress).
An athlete can then calculate his/her W/kg values over each duration, and see where their relative abilities lie.
An example is shown below for an endurance cyclist we coach, who tends to excel most at time trials and other long, steady-state efforts. Unsurprisingly, this rider’s 5-min and 20-min powers are rated higher than their 1-min and 5-sec powers.

Power profile for cyclist who excels in time trials, using power profile data from Training and Racing with a Power Meter by Andrew Coggan & Hunter Allen (copyright VeloPress).
When assessing your power profile through this method, each maximal effort should ideally be performed on a separate day, when relatively fresh, so that a true maximal (or near maximal) performance can be achieved.
Coggan explains here that his approach to developing the reference values was to ‘“anchor” the upper and lower ends of each range based on the known performance abilities of world champion athletes and untrained persons, respectively […] The resultant values for intermediate performances were then cross-checked against available data to assure that this approach resulted in valid guidelines.’
As far as we are aware, TrainingPeaks still uses these reference values to set the gradings used in their power profile chart, shown below:
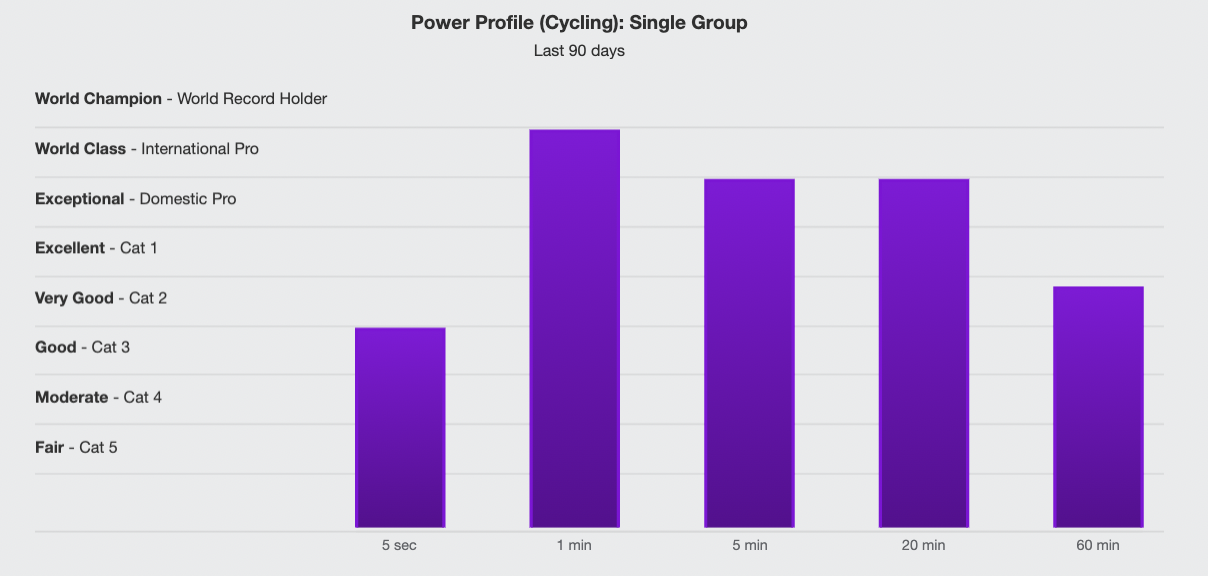
Cycling power chart from TrainingPeaks.
It’s worth noting that although each test duration is intended to capture a unique physiological parameter, this does not mean for example, that the 1-minute effort is a purely anaerobic effort, or that the 5-minute effort is performed entirely at VO2max. Instead the powers over these various durations are just selected because they tend to correlate with these physiological abilities. For example an athlete with a very strong VO2max would tend to have a strong 5-min power, and so on.
We find Coggan’s original method of power profiling very useful. It presents a relatively quick and easily-interpretable method of understanding rider type and for tracking changes over time.
One of the key draw-backs is that it still presents a fairly simplified view of a cyclist (albeit a big improvement over basic FTP testing!). It tells us nothing, for example, about an athlete’s ability to repeat or produce hard efforts in the presence of fatigue, which is key to success in many cycling disciplines. It also generally relies on the ability of an athlete to produce maximal efforts in training, which is no small feat.
Power Profiling: Newer Methods
As more complex data analysis tools have become available to the general cyclist, increasingly sophisticated approaches have been taken to power profiling.
Power-Duration Curve
Also known as the ‘cycling power curve’, this approach takes data from every ride you’ve performed over a given period (e.g. last 90-days), finds the max power you’ve sustained over every duration, from 1-second right up to several hours, and plots these on a curve like the one shown below, where the yellow line shows actual maximal power data, and the red is a smoothed approximation of the power curve:

Power duration curve generated using WKO5 software.
Thus, rather than looking at just 4-5 discrete durations/wattages (e.g. 5-seconds, 1-minute, 5-minutes, and at FTP), you can look in more detail at the relationship between power and time.
Each athlete’s profile follows a ‘hyperbolic’ curve. But the precise shape differs slightly for different types of rider. Platforms like WKO5 helpfully provide reference lines (e.g. for ‘world-class’, ‘exceptional’ etc.) to get a sense of where an athlete is stronger and more limited.
In the example above, we can see that although the athlete has good power over all durations, she is particularly strong over durations of around 1-minute, and is weaker over durations lasting several seconds, and those lasting beyond 40-minutes or so.
Many platforms offer the ability to plot a power duration curve, including TrainingPeaks, WKO5 and intervals.icu. Platforms like WKO5 also greatly assist with interpreting these subtle differences, by classifying the shape of the power curve into four types: the ‘all-rounder’, the ‘pursuiter’, the ‘sprinter’, and the ‘time trialer’, to give a more meaningful description of rider type. In the example above, the rider is classified as a ‘time trialer’, presumably due to her similar 5-min and 20-min powers (although we would disagree with this classification somewhat, due to the rider’s strong 1-minute power, which we think makes her more of an all-rounder).
One of the major limitations of this type of power profiling is that the curve can be skewed based on whether and how many truly maximal efforts you’ve performed. In order for the curve to be accurate, it requires maximal efforts to have been performed across a range of durations, from several seconds, right up to ~30-40 minutes, and various points between. Ideally, each effort is performed on a separate day, after adequate recovery, in order to allow a truly maximal (or near-maximal) effort. In reality, few people do such comprehensive power testing, and in these instances, you could draw unreliable conclusions from your power curve.
We personally also find the power curve harder to interpret than the basic Coggan method, and we are not convinced that the power curve offers much additional insight when it comes to power profiling, especially given the risk of drawing invalid conclusions from non-maximal data!
Wahoo SYSTM Full Frontal 4DP Test
Wahoo offer their own proprietary power profiling system, via their SYSTM app, known as the ‘Full Frontal’ test. This was previously available through Sufferfest before it was bought by Wahoo, and the test remains very similar.
It’s very closely related to the original Coggan power profile, where riders test their power over 5-seconds, 1-minute, 5-minutes and 20-minutes. However, in this case all maximal efforts are performed in a single session, and it seems that different reference values are used from Coggan’s original table of reference values, in order to account for the inevitable fatigue that sets in as the test wears on.
The app generates a chart showing the strength of your 5-second, 1-minute and 5-minute power, relative to your 20-minute power. It also generates a rider typology, based on 6 different classifications of: Sprinter, Pursuiter, Attacker, Time Triallist, Climber, or Rouleur.
In our view, the biggest limitation of the Full Frontal test is that it’s VERY tough! Getting psyched up to do a single maximal effort is hard enough, but going all-out over 4 different durations in just 1-hour is a really big ask, and not one we’d generally ask our athletes to put themselves through. In our experience, mental toughness will have a big impact on your test results, perhaps to such an extent that the results don’t reflect your true abilities very well.
Power-Speed Profiling
So far, all power profiling methods have used Watts/kg as a way to benchmark power. Watts/kg is an important performance marker, particularly on climbs, and is a helpful way to compare cycling abilities across riders of different weights. However, it has less validity when predicting performance on flatter terrain and/or at higher speeds, where raw wattage and aerodynamic drag are bigger performance determinants.
This limitation led two well-respected coaches and physiologists (Marco van Bon and Guido Vroemen) to develop a new method of power profiling, which they call ‘power-speed profiling’. In this method, a rider performs maximal efforts over 5-seconds, 15-seconds, 30-seconds, 1-minute, 4-minutes and 20-minutes (this latter effort being used to estimate 60-min power). The power values are then input into a calculator, along with information on rider height and weight.
Some complex algorithms are used in the background, which involve modelling aerodynamic drag, climbing and rolling resistance and the friction of bike parts.
Ultimately, the calculator then outputs a ‘performance index’ for each duration and for various inclines. The performance index reflects the ratio of the power produced by the rider, relative to the power that they would need to produce in order to ride at the same speed as a top professional cyclist.
So for example, a performance index of 90 indicates that a rider was able to produce 90% of the power needed to ride at the same speed as a pro tour cyclist.
An example of the output from the calculator is shown below. A big benefit of this testing approach is that it allows a more comprehensive and arguably more valid understanding of a rider’s strengths and limiters for different types of terrain/race, and particularly those where watts/kg is less important than raw power and drag. The key drawback is that quite a large number of test efforts need to be performed.

Example power report taken from http://powerspeedprofile.com.
Critical Power Testing
It’s worth briefly mentioning critical power testing here. Regular readers of our articles, Physiology Guide, and Hill-Climb Handbook are probably already familiar with this testing method.
On first glance this seems to be a power profiling method, because it involves performing maximal efforts of differing durations, and establishing the relationship between the power achieved. However, the critical power method differs from power profile testing, because we don’t compare powers to reference wattages. We therefore won’t include it as a power profiling method. It’s worth noting though that it does present an alternative means to understand your strengths and limiters. If you’re interested in learning more about critical power testing, check out our article here.
Using power profiling to understand rider type
The figure below shows some example power profiles, based on Coggan’s original profiling system.

a) All-Rounder
Profile (a) may represent an ‘all-rounder’ who is similarly strong across all tested durations. This profile might be suited to someone looking to race well as a GC contender in a stage race, or do well in disciplines spanning both longer and shorter durations (e.g. time trials, and sportives). This profile is also well suited to athletes competing in punchy endurance disciplines like cross-country MTB.
This profile might also reflect an athlete who is naturally strong anaerobically, but who has spent a lot of time working on their aerobic fitness. This athlete might be working towards achieving a profile closer to that shown in (b), but due to their genetic makeup, profile (a) might be a more realistic goal.
b) Endurance Time Triallist
Profile (b) is a profile that may be best-suited to an endurance cyclist competing in longer, more steady-state events such as time trials, gran fondos or sportives (depending on the course profile). Here, the 5-min and FTP powers appear notably stronger than the 1 minute and 5 second powers. This likely indicates that VO2max is strong, and that the lactate threshold is relatively high (i.e. a high ‘fractional utilisation’).
c) Track Sprinter/Hill-Climb Specialist
Profile (c) is often best suited to a track sprinter or a hill climb specialist competing over durations of several minutes. For cyclists competing in these types of disciplines, it’s important that both anaerobic capacity and VO2max are high. This is reflected in this instance by the apparently high 1 and 5 minute powers.
Having a good neuromuscular power (i.e. ability to activate the Type IIx muscle fibres) is also often important in these disciplines, as reflected by the high 5 second power.
The high anaerobic capacity in these athletes often comes at the expense of a lower FTP. However, that’s not a problem, given threshold power is of relatively minor importance in these types of discipline.
d) Typical New Cyclist
Finally, profile (d) may be typical of someone that’s new to cycling, or someone who has been following a high-intensity, indoor training program, which often prioritise high-intensity work at the expense of low-intensity volume.
Here, the anaerobic system appears to be well-developed (high 1 minute power) relative to the aerobic system (5 minute power and FTP). However, all abilities are lower than in profile (c).
Neuromuscular power can be varied in these types of athletes, depending on whether any sprint training has been completed in the recent past.
Using power profiling to guide training
There are several ways you can use your power profile data to inform the types of training you do…
1. Perform a gap analysis
A first option is to perform a ‘gap analysis’ to identify the differences between your current physiological profile and your desired profile. You can then focus on training that will help you reduce those gaps.
For example, someone with profile (d), but who wants to do well in sportives, will want to move their profile closer to (b), and thus should focus on developing their aerobic fitness, including sessions that will work on improving VO2max, reducing lactate production, and improving lactate clearance. This should see an upwards shift in 5 minute power and FTP.
Someone with profile (a) could move their profile closer to (c) by incorporating more anaerobic and sprint training, with efforts spanning 5-seconds to 2-minutes. They may also benefit from reducing any training that tends to reduce glycolysis and promote fat oxidation – particularly fasted training.
We have a free workout guide to help you target specific fitness attributes available here.
2. Assess Fractional Utilisation
Another useful thing to consider, if you’re looking to develop your aerobic fitness, is where your FTP sits relative to your 5-minute power. This can give you an approximate idea of your so-called ‘fractional utilisation’ (i.e. where your lactate threshold sits relative to your VO2max).
If your FTP is stronger than your 5-minute power, in a relative sense (e.g. 5-min power rated ‘good’ and FTP rated ‘excellent’), then you probably have a high fractional utilisation, and your VO2max is likely limiting any further improvements in your lactate threshold. This might suggest that training should prioritise developing your VO2max, in order to ‘make space’ for further improvements in your lactate threshold.
On the other side, if your FTP is quite low relative to your 5-minute power (and particularly if your 1-minute power is also quite high) this may suggest your fractional utilisation is quite low. In other words, your FTP sits at a low percentage of your VO2max, and you probably have quite a lot of headroom to develop your FTP without needing to necessarily increase your VO2max. In order to become stronger in endurance disciplines, you’ll likely benefit from focussing on training to reduce the contribution from the anaerobic energy system, and increase your ability to use fats for fuel. This could include:
long, low-intensity fasted rides,
low-cadence intervals at a middle-intensity (i.e. between ~75-90% FTP or a 5-6/10 effort) completed in a fasted state, and
intervals slightly above threshold power, which seem to work at improving lactate shuttling, among other things.
To understand more about fractional utilisation, check out our article here.
3. Iterate Intensity Targets
Finally, one other way that power profiling can help when prescribing training is in understanding whether you might need to iterate your intensity targets for your training sessions.
When training with power, you’ll generally have a range of powers to work within, expressed relative to FTP (e.g. ride between 103-108% FTP for 6-minutes). These are usually based on population averages, or in other words the power a ‘typical’ cyclist can hold for a given duration.
However, depending on your unique physiology, these powers can sometimes be a little too high or low.
For example, someone who has a very strong FTP relative to their abilities over shorter durations (e.g. an endurance time trialist) may find they need to reduce their power targets for sessions above FTP. A typical VO2max session might usually comprise 6x 4-min efforts between 108-115% FTP. However, someone with an endurance time trialist profile may need to reduce their power targets down to perhaps 103-105% FTP to account for their high FTP relative to VO2max and anaerobic capacity.
Similarly, this cyclist may also want to consider doing their long endurance rides closer to the top end of Zone 2 (i.e. perhaps between 65-80% FTP), because they are likely to have well developed endurance and a good ability to use fats for fuel, even at higher percentages of FTP.
Someone with the opposite profile (e.g. similar to the track sprinter/hill climb specialist) may want to consider doing the inverse. So they may want to slightly increase the power targets for sessions above FTP, and reduce the power target for sessions below FTP. For example, the 6x 4-min session might be pitched around 110-120% FTP to account for the athlete’s strong anaerobic capacity, whereas endurance rides may be pitched at around 50-60% FTP to account for the athlete’s lower ability to use fats for fuel.
Power Profiling: A Case Study
It can be helpful to illustrate the benefits of power profiling with a real-world case study. Here we present power profile data from an elite-level female road cyclist, during the 3-months leading into one of her A-priority competitions.
We’ve shown both her power-duration curve (aka ‘cycling power curve’), and power profile chart using the original Coggan approach, so you can see what the data looked like in both instances.

Power duration curve for 2021, generated in WKO5.

Cycling power chart for 2021, generated in TrainingPeaks.
We can see that the athlete had excellent power across most durations (excluding her ~5-second sprint). However, she seemed to be anaerobically dominant, with a particularly strong 1-min power, getting progressively weaker as the length of the effort went on.
We suspected that this athlete’s longer-duration power was mainly limited by her aerobic efficiency, ability to use fats for fuel, and general aerobic condition of the muscles (e.g. capillary and mitochondrial density).
Over the next year of training, we therefore tried, where possible, to include bigger volumes of riding to target these abilities. We also learnt from previous training that the athlete responded well to long (5-8 minute) efforts above her threshold power, which probably helped with things like mitochondrial efficiency, developing the aerobic capacity of higher-power muscle fibres, and improving lactate shuttling.
Given the types of races the athlete was targeting in the coming year (including long road races of several hours, and a few stage races), building her abilities over longer durations was a top priority. A secondary aim was also to build her sprint power through dedicated sprint training sessions.
A year on, and we saw really positive changes in this athlete’s power profile, as shown below:

Power duration curve for 2022, generated in WKO5.

Cycling power chart for 2022, generated in TrainingPeaks.
In particular, her power between roughly 3-min up to 25-mins has shifted from ‘exceptional’ to ‘world class’. These may appear to be fairly subtle changes, but in real terms, this was a shift in her 20-min power from 5W/kg to 5.4W/kg, and an increase in 5-min power from 5.9W/kg to 6.1W/kg, which is very meaningful at the level she is competing at. Indeed, these improvements in fitness resulted in a silver medal at her priority event this year, and clear strides forward in her abilities relative to her peers.
We did however see less change in her sprint performance, and this is something we’re looking to improve upon in this coming year, by focussing more on weight training in the gym.
It’s worth noting that although her 60-min power appears lower in 2022, we didn’t specifically test power over this duration, so the maximal power data isn’t valid.
As with many cyclists, this particular athlete holds down a demanding job while also training and racing, and has comparatively limited time to train compared with many of her direct competitors. Having a clear understanding of this athlete’s strengths and limiters really helped us understand where to focus her precious training time, and was undoubtedly instrumental in seeing the improvements we did through the last year.
Power Profile Testing Protocol & Tips
Our recommended power profile testing protocol would be to perform the testing over three sessions, as outlined below:
5-seconds and 1-minute efforts, taking roughly 20-minutes of recovery (very gentle spinning) between each effort. We recommend doing 3x 5-sec sprints, because it can be helpful to do a couple of practice runs to get the gearing right!
5-min test effort
20-min test effort
Often we plan testing over a 4-day period, taking a recovery day between the second and third test.
Each effort should be paced in order to hold power as consistent as possible from start to finish. It will probably take a few rounds of testing before you get good at this, but in the meantime you can use data from past training and racing to try to guess what power you think you can probably hold.
Before each test effort, we recommend warming up by riding for 20-30-minutes, largely at a Zone 2 intensity (55-75% FTP, 60-70% Max HR, or ~3/10 effort). However, we recommend including 2x 2-min efforts at slightly above your estimated FTP (e.g. 105-110% FTP or an 8/10 effort), taking 2-mins of easy spinning between. This helps to prime the aerobic system so that it responds faster at the start of each effort (also known as speeding up ‘VO2-On kinetics’, which you can read about here). Ideally these would be included roughly 15-minutes before your test effort begins.
If you’re using a power-duration curve to assess your profile, then you don’t have to stick rigidly to these specific test durations. For example, you can do 4-mins rather than 5-mins. However, it’s important to still have a good spread of testing data, covering both longer, medium and shorter durations. We recommend testing at least the duration ranges of 1-10 seconds, 40-80 seconds, 3-7 minutes, and 12-25 minutes respectively.
Finally, make sure you’re well fuelled and hydrated, and not overly fatigued on testing days, so that you’re ready to perform well. And practice your pacing. The accuracy of efforts will improve the more you test, because you’ll have better knowledge of what power to start out at.
Summary
Power profiling can be a good way to gain insight into the type of rider you are, the types of training you need to do, and how your fitness is evolving. In our view, the traditional power profiling method developed by Andrew Coggan is a simple and effective option, and is preferred over using a power-duration curve, as you’re less likely to misinterpret the data.
If you want to learn more about power profiling, and other methods of assessing your physiology, check out our Cycling Physiology and Training Science Guide, which covers all the need-to-knows for the self-coached cyclist or coach!