
Cycling Training Zones: A Detailed Guide
The use of training intensity zones for cycling is a well-established method of planning training.
Since there’s a relationship between the intensity of training and certain adaptations that are important for performance, the ability to plan workouts using a common intensity-based language and system, as well as to track the time spent in each zone, can help bring important structure to a training program.
In this guide, we’ll lay out the most commonly used and “logical” methods of delineating training intensities and discuss the associated benefits and potential drawbacks for each method. Along the way, we’ll also introduce and explain some new but helpful metrics and other terminology that can improve the planning and tracking of training.
Whilst there are more training zone systems in existence than are covered in this guide, we have tried to include those which we as coaches feel are most intuitive and effective for cyclists. There are numerous systems (even within popular programs like TrainingPeaks) that we believe are needlessly confusing and thus are not worth discussing or recommending here.
The zoning systems we’ve chosen to talk about are:
We’ll go through these in turn, provide a summary of thoughts on each system, and wrap up our global thoughts on training intensity zones at the end.
1. Threshold and HR Cycling Training Zones
Perhaps the most widely-used training intensity zones are those based on a threshold metric, including both power-based threshold like Functional Threshold Power (FTP) or Critical Power (CP) and heart rate (measured in beats per minute - BPM). The latter can be anchored to either maximum heart rate or threshold heart rate. There are numerous heart rate and threshold-based zoning systems, but we’ve presented a common one below, which is adapted from Dr Andrew Coggan’s seven-zone system. We have selected this system because the zones are somewhat physiologically meaningful, and each has a specific purpose in terms of the adaptations they are trying to elicit. You’ll also find the perceived exertion values are also included:
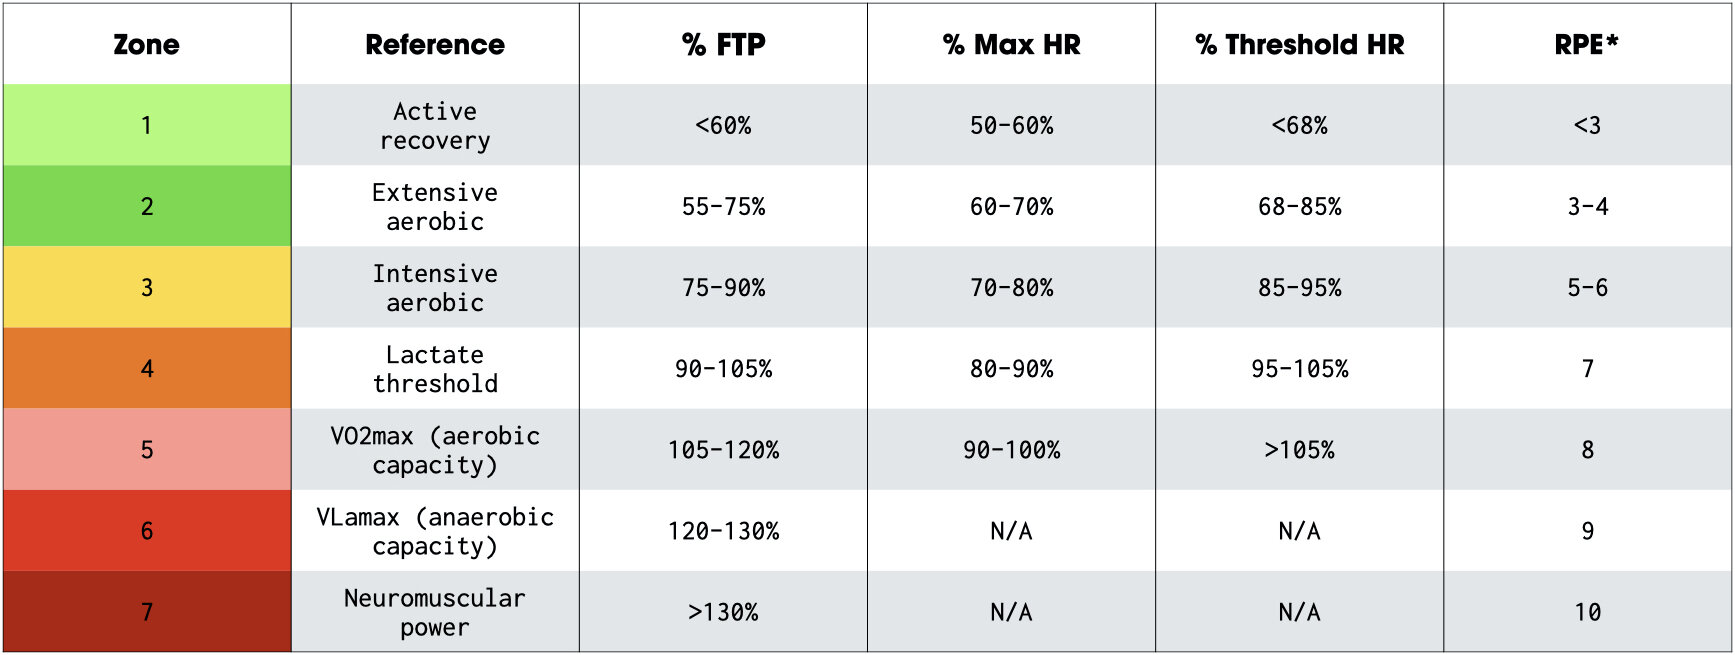
*Rating of Perceived Exertion (ascending intensity scale of 1-10)
Note that there isn’t a 1:1 correspondence between these heart rate and FTP zones. We often find that the heart rate zones come out a bit higher than the FTP zones, so riding at zone 2 power, might only result in Zone 1 heart rate. For this reason, we tend to err on the lower end of the heart rate zones, especially if the goal of the session is recovery.
Below, we’ll explain a little more about the purpose of each zone, and then go on to discussing methods for establishing FTP, Max HR and Threshold HR. If you are already familiar with this, you can just skip through to the next section on the Polarised Model.
Zone 1
This is the active recovery zone and is used for regenerative purposes more so than for inducing a training stress, though very long durations spent in Zone 1 will indeed promote peripheral (i.e. muscular) adaptations like increases in mitochondrial content and capillary density around the slow twitch (Type I) muscle fibres, in turn improving the body’s capacity for aerobic metabolism and use of fat as the primary substrate at greater and greater intensities (more on this in Zone 2 below). Typical applications of Zone 1 are during active recovery rides of 30 minutes to 2 hours in duration, and between work intervals in higher intensity interval workouts to aid in the clearance of lactate.
Zone 2
This is the zone you’d ideally be aiming to accumulate the most training time in. It’s an intensity that’s sustainable for hours at a time, and is also optimal for stimulating those peripheral adaptations mentioned above (e.g. increased mitochondrial density). Zone 2 is also specifically at an intensity that trains the muscles to become better at using fats rather than carbohydrates for fuel. This is important, because when carbohydrates are used for fuel, this produces lactate and associated fatiguing metabolites, which can accumulate, leading to fatigue. Fat oxidation, on the other hand, has no such fatiguing byproducts, and is therefore the preferred fuel source (more on this here). For disciplines that are very long, it’s also beneficial to be able to use a higher proportion of fat for fuel because the body has sufficient fat stores to fuel exercise lasting several days, whereas carbohydrate stores are only sufficient to support all-out exercise lasting ~1.5 hours.
We have a dedicated post explaining Zone 2 training in depth here.
Zone 3
The ‘Intensive Aerobic’ zone is still an intensity that promotes aerobic adaptations. However, the intensity is slightly higher than Zone 2 and should therefore generally be used sparingly as it can cause substantially more fatigue. The main purpose of this zone is to recruit additional muscle fibres that are not usually recruited in a Zone 2 ride until the latter stages of a long ride, and to stimulate aerobic adaptations within these lesser recruited fibres, which are predominantly of Type IIa. In endurance events, these Type IIa fibres become important later on in a race, as the more aerobically efficient Type I fibres fatigue and pass over work to the Type IIa fibres. Zone 3 training can therefore help with muscular endurance (i.e. ability to sustain power below threshold without a concurrent increase in heart rate/oxygen demand), by making the Type IIa fibres more aerobically efficient. Zone 3 training can also help increase the lactate threshold by reducing lactate production within Type IIa fibres. Zone 3 can be structured into intervals or used for the duration of a full ride, depending on ability level.
“Sweetspot” zone?
There’s a so-called “sweetspot” intensity range, which sits at the top of Zone 3 and into lower portion of Zone 4 - essentially right below the 2nd threshold range (e.g. FTP, Critical Power, Lactate Threshold etc). The term comes from the idea that this intensity is a “sweetspot” in the sense of it being the best catch-all intensity and is said by proponents of training at this level to be the best means of improving endurance, threshold power etc. It’s important to understand though this “sweetspot” is a marketing term, and in our humble opinion a predatory one, which seeks to mislead uninformed athletes by convincing them (with false logic) that the “medium-hard” intensity, otherwise known as the “grey-zone” that they would naturally gravitate towards in their training is in fact the most effective way to train. This goes completely counter to scientific studies of both pro/elite and amateur cyclists and many cyclists anecdotally report noticing quick wins from a sweetspot-heavy approach and subsequent stagnation and burn out when trying to employ this method over the medium to long-term.
Zone 4
Training around the lactate threshold is somewhat controversial, with potentially as many advocates as there are opponents. This zone sits right at the point where the rate of lactate production begins to exceed the rate of lactate clearance, meaning the concentration of lactate and associated fatiguing metabolites increases rapidly beyond this zone. The purpose of working in Zone 4 is often to improve the muscle’s ability to ‘shuttle’ (i.e. move) lactate away from the working muscles and to other parts of the body where it can be oxidised to produce energy. This in turn contributes to an improvement in lactate threshold power, or FTP. Zone 4 can also be used to improve your tolerance to riding at a moderately hard intensity for extended periods of time. Intervals in this zone will typically last between 6-minutes to 40-minutes (or even longer if oscillating power is used).
Zone 5
Zone 5 is designed to be at an intensity that elicits ‘VO2max’ - or in other words the maximal rate of oxygen uptake and utilisation - thereby developing this ability. While VO2max can be limited by a number of factors (see here), the main adaptation that Zone 5 training elicits is an increase in the heart’s ‘stroke volume’. Or in other words, an increase in the amount of blood (and thus oxygen) the heart can pump per beat. Zone 5 training probably also contributes to an improvement in mitochondrial efficiency; another factor influencing VO2max. Intervals in this zone will typically last between 2 to 6 minutes, although they may last longer if oscillating/adjustable power is used. An example of this would be intervals where power is adjusted to keep heart rate within 5-10% of maximum, where power may intermittently fall to Zone 4, and then increase again as heart rate begins to drop. We have an article on VO2max training here, if you want to learn more.
Zone 6
Training in Zone 6 can be used to increase the anaerobic power by improving the rate of glycolysis. This means a greater amount of power can be produced over short (~10-120 second) efforts. Depending on the structuring of intervals, Zone 6 training can also be used to improve anaerobic stamina - which is the length of time an anaerobic effort can be sustained. We have written in detail about anaerobic training here. In general, for many disciplines, Zone 6 training should be used sparingly, as the increased rate of glycolysis can result in a decreased lactate threshold, which may be undesirable.
Zone 7
Zone 7 or the neuromuscular zone includes very short efforts (<10-15 seconds), which are designed to activate all (or nearly all) muscle fibres. Rather than training a specific energy system, these sessions help forge neural connections to muscle fibres so that you become better able to activate them in subsequent training or racing. In practice, Zone 7 training contributes to improved anaerobic power, particularly over very short durations (e.g. 10-seconds or less).
Testing Protocols
In order to set the cycling training zones, a test needs to be undertaken to determine FTP, max heart rate or threshold heart rate (whichever you choose to use). We’ll describe some of the testing options below. However, if you are already familiar with this, you might want to skip straight to section 2, on the polarised model.
To ensure accurate intensity targets, testing should be routinely repeated to adjust the training zones for changes in fitness (for max heart rate this is less critical, although it will reduce with age, so should still be repeated e.g. once per year). When a power meter is used, it’s also possible to assess rate of progression in certain areas of performance by measuring improvements in wattage for a given duration.
Let’s firstly look at how to test with a power meter…
FTP Tests
Functional threshold power (FTP) has several definitions, but typically aims to reflect the maximal steady-state power an athlete can produce for a sustained period (e.g. 40-60 minutes), with 1 hour being the most common duration. It’s intended to align closely with the lactate threshold - which is the maximal power that can be sustained while lactate levels remain constant. There are several FTP test protocols that can be chosen in order to estimate the FTP, including:
20 minute FTP test
A maximal 20 minute effort, where a certain % of the result is taken as the FTP (we would recommend 92-93% for most athletes based on our experience with how the numbers relate to measured lactate threshold). This 20 minute effort may or may not be preceded by a shorter but nearly maximal effort of 3-5 minutes, which is designed to induce fatigue to offset the anaerobic energy system’s contribution to the 20 minute effort (given that this would be a minor contributor to the longer ~60-minute power being estimated):

2x 8 minute FTP test
This test features a set of 2x 8 minute efforts, where each is performed at the highest power output that is sustainable across both (i.e. the first effort would be paced sub-maximally in view of the second effort). The average power of the two efforts is then taken and a % of this average is again taken as the FTP (typically ~90%):

FTP Ramp Test
A ramp or step test design, where a calculation is made based on the step that the athlete reaches and how far into the step they were able to get before complete exhaustion. These steps typically start very easily (<50% of expected FTP) and increase in intensity in 1 minute increments (typically 20-25 watts each time).

This will produce a power file which looks very similar to this, showing the gradual step-wise increase in power output until total exhaustion and the end of the test:

The test is used firstly to establish maximal aerobic power (i.e. power at VO2max, or MAP), which can be calculated as:
Maximal Aerobic Power (MAP) = Power at last completed stage + (Power increment for incomplete stage multiplied by the percentage of the stage completed).
For example, if an athlete completed a full stage at 400W, and then terminated the test at 30-seconds into the 420W stage (i.e. half way through), the MAP would be 400W + 50% of 20W (where 20W is the increment of the incomplete stage, which increased from 400W to 420W). In other words MAP would be 410W.
Typically FTP is then estimated to be 75% of MAP.
So in our example above, FTP would be 75% of 410W, or 307.5W.
Note that some sources use a higher FTP estimate of 82.5% MAP. Ultimately, the correct percentage will depend on where your lactate threshold sits relative to your aerobic capacity, which is why ramp tests can be so inaccurate for FTP determination.
The concepts above were originally developed by and are © CycleCoach & Ric Stern.
Critical Power Testing
An alternative approach to an FTP test is the critical power test. This test has the benefit that it will also provide information on the size of your anaerobic capacity and for this and other reasons, this is our preferred field testing method.
The basic premise of this test is that power output above a certain ‘critical power’ follows a hyperbolic power-duration curve as shown below.

The curve can be defined by two parameters: the critical power (CP) and W’ (pronounced as ‘W prime’).
CP is the power output that you’ll fall towards when riding at a high intensity as exercise duration is increased ‘indefinitely’ (‘indefinitely’ is a mathematical construct, and not actually true in practice, which is why this power-duration model fails to hold at or below CP). In practice, people can typically only sustain power outputs at CP for around 30-minutes (Vanhatalo et al., 2011).
CP occurs at around the maximal lactate steady state (Poole et al., 2016), and can therefore be used in place of FTP to set training zones, and track changes in the lactate threshold.
W’ (measured in kJ – i.e. units of energy) is the amount of work that can be done above the CP, and is a marker of anaerobic capacity.
By performing a series of maximal tests (we recommend doing 3-4 maximal efforts, each lasting between 3-20 minutes), it is possible to determine CP and W’ from the power-duration relationship. The maths behind these calculations are beyond the scope of this article, but you can read more about critical power and download our critical power calculator here.
Maximum Heart Rate Test
To get an accurate gauge of your maximum heart rate, you can perform a simple test like riding intensively for ~10 minutes, following this with a maximal 1 minute effort, and finishing with a 20 to 30 second sprint:
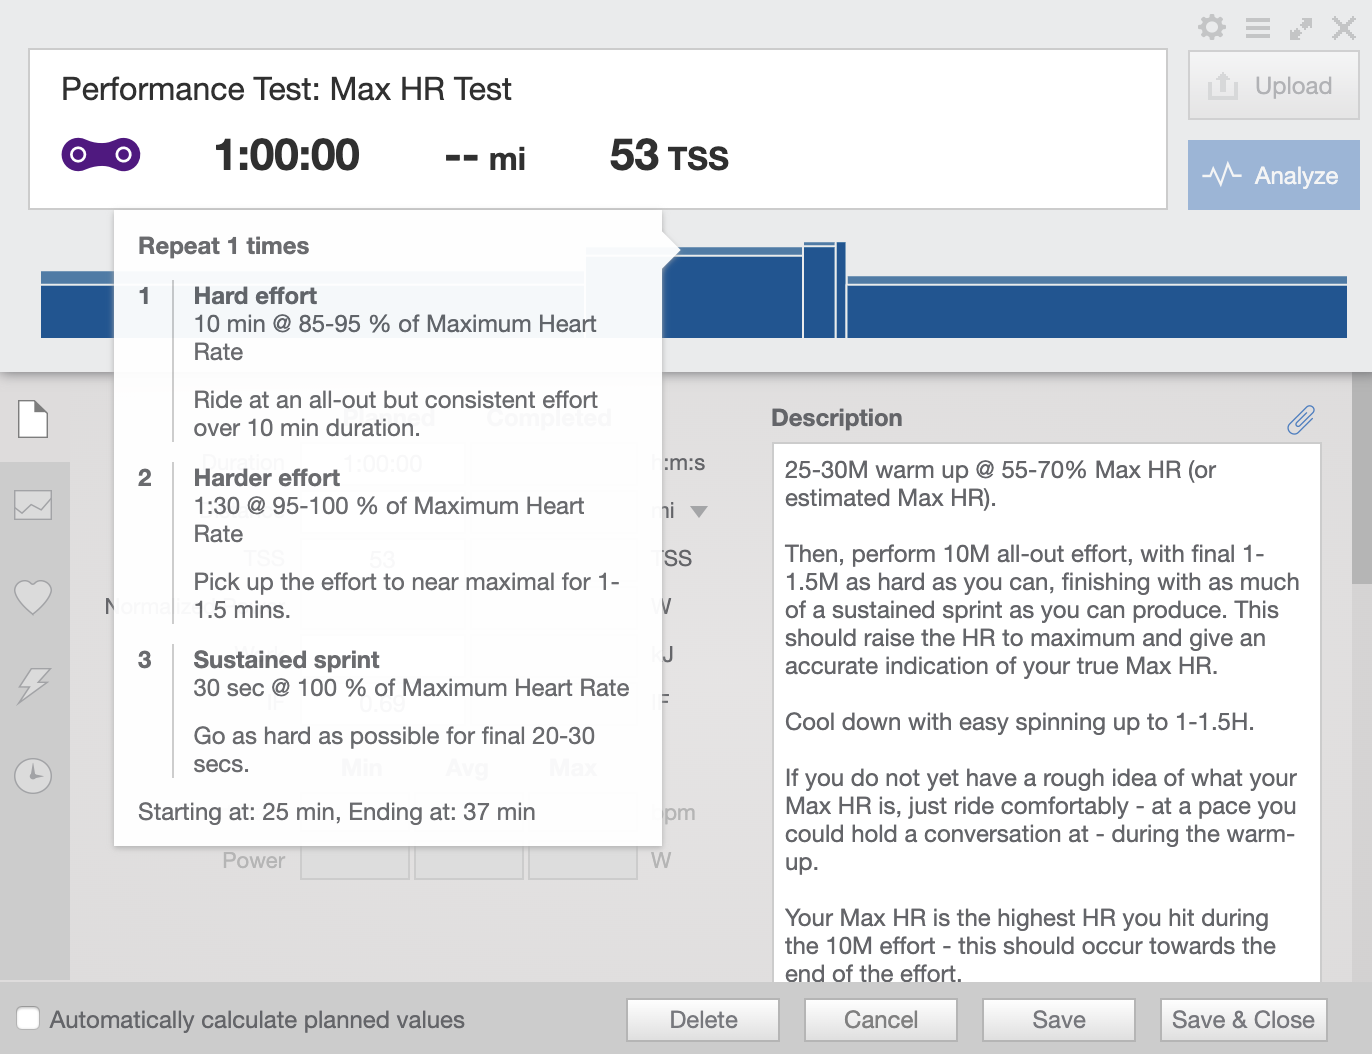
Cool down gradually for a further 10-15 minutes after this maximal effort is complete and ideally repeat the test a few times to improve the accuracy of the results, ensuring ample rest between the tests.
You can also review recent race files to see what heart rate you were able to hit - if you raced really hard for several minutes at the end of a race, for example, it’s likely that you hit something close to your max heart rate. Although be wary of erroneous heart rate data, as this can be quite prone to error. Ideally, you’d use a max heart rate value that you’ve seen a few times in the past, and can be confident with.
Threshold Heart Rate Test
To approximate your threshold heart rate, a similar effort to the 20 minute FTP test is performed.
Begin by warming up for 10-15 minutes, building up from 70-90% of predicted Threshold HR. If you’re unsure what this might be, use a figure that's roughly 90% of Maximum Heart Rate.
Then, perform 30M all-out but evenly paced effort, making sure to record the effort so the final 20 minutes of the effort can be isolated after completion. Your average heart rate for this final 20 minutes should be a good approximation of your threshold heart rate. Cool down with a steady 10 minutes of easy spinning to gradually lower the heart rate:

Again, repeating this test several times will help to ensure an accurate approximation of threshold heart rate.
2. Polarised Training Zones
Perhaps the simplest yet one of the most scientifically grounded training intensity zone systems is what’s commonly called the “polarised” model, or the “3-zone” system.
This system is used by several national federations and coaches, and is well supported in the scientific literature. Unlike the previous model, which is anchored around one physiological variable (either FTP, threshold heart rate, or max heart rate), the polarised model is based on two physiological cut-points, defining specific metabolic conditions within the body. These cut-points are either the first and second ventilatory thresholds or the first and second lactate threshold or “turnpoints”, depending on the specific testing protocol used.
Here’s what this model looks like, including the “VT” (ventilatory thresholds) and “LT” (lactate thresholds or turnpoints), which define the boundaries of each zone:
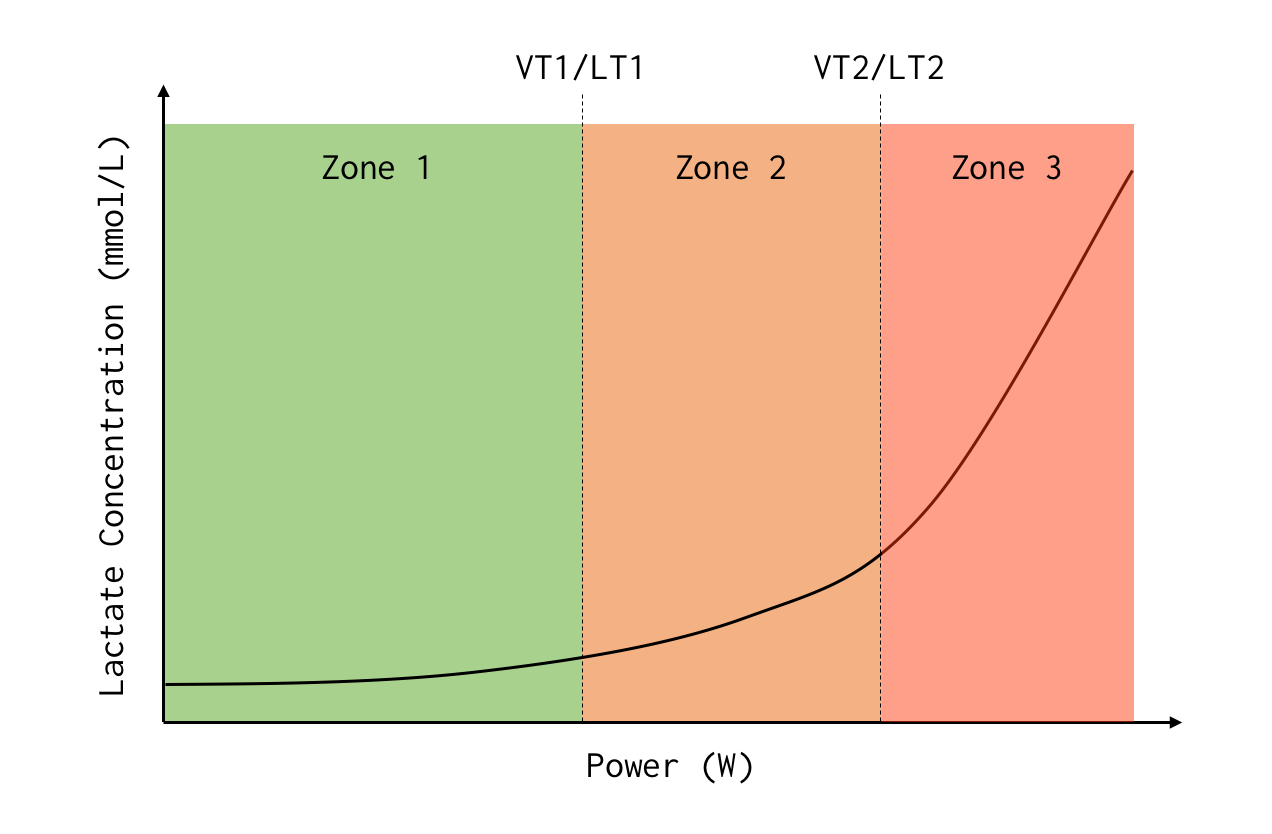
These cut-points can be established from lab testing (by measuring expired air or taking lactate samples during one or more exercise tests), or using more rudimentary “feel” of what is easy, medium and hard intensity (corresponding to zones 1, 2 and 3 respectively). The specific locations of the cut-points depend on the testing protocol used (there are lots!).
In general, the lower cut-point is intended to capture the workload at which lactate levels become substantively elevated above resting levels, and the ratio of expired gas to oxygen consumption swings upwards, reflecting an increased contribution to power production from glycolysis. Above LT1/VT1, but below LT2/VT2, blood lactate levels can still be maintained in a steady state, but are higher than they would be when resting.
The upper cut point (LT2/VT2) then broadly reflects the point at which blood lactate levels can no-longer be maintained in a steady state, and begin to accumulate rapidly even when power is held constant. Around this point, the ratio of expired air to expired CO2 also swings upwards. This reflects the point at which the aerobic energy system can no longer match energy demand.
These cut points have been shown to correlate well with other physiological inflection points, such as muscle activation (assessed via EMG), and catecholamine levels (reflective of how stressful exercise might be) (Seiler & Kjerland, 2006), further supporting the physiological meaningfulness of this model.
Relating the polarised model to the seven-zone model above, on average, VT1/LT1 occurs at around 52% of Maximal Aerobic Power (MAP) (Cerezuela-Espejo et al., 2018), which would sit somewhere around ~65-70% of FTP, or around the top of Zone 2 in a seven-zone model (this is a very general approximation, and would depend on individual physiology, which can vary considerably). LT2/VT2 would sit around the top end of Zone 4 in the seven-zone model.
The polarised model typically advocates training mostly within zones 1 and 3, with only a minimal amount of training in zone 2 (e.g. 75% of sessions in zone 1, 5% in zone 2 and 20% in zone 3). A key limitation of the polarised model is that there is no differentiation within the three, fairly broad levels. So it’s hard to say where, for example, to pitch training to develop the anaerobic power versus training to develop the aerobic capacity.
3. Modelled Cycling Training Zones
Next up, we’ll look at training zones produced by modelling software such as WKO5 or INSCYD.
These systems are intended as an enhancement of the seven zone system presented in Section 1. A key limitation with the seven zone system (and other similar systems) is that they are anchored around one physiological parameter e.g. FTP. However, for intensities above FTP, there is considerable variability in the optimal power and duration that stimulates specific training adaptations. For example, for someone whose FTP is very high relative to VO2max (as would likely be the case in a well-trained endurance cyclist), VO2max intervals should be done at a lower percentage of FTP. In contrast, for a sprinter whose FTP is likely to be considerably lower than their VO2max, then VO2max intervals should be at a higher percentage of FTP. The classic seven zone system does not take this variability into account, instead just giving training zones for the ‘average’ cyclist.
Modelling software such as WKO5 and INSCYD present a solution to this problem by using maximal power data to build a model of an athlete’s physiological profile and thereby derive individualised training intensities.
As an example, WKO5 uses an individual’s historic power data (typically taken over the last 90 days) to build a power-duration curve, such as the one below. Here, the yellow line is the actual achieved maximal power for a given duration, and the red is the smoothed power duration model.

Power-duration curve for an athlete, showing actual attained power (yellow line) and smoothed modelled power (red line).
The WKO software uses the power duration model to establish physiological characteristics of an athlete (such as where their FTP sits relative to VO2max), and to derive training zones. These training zones are termed ‘iLevels’ (short for ‘individualised levels’). The model also generates ‘Optimised Intervals’, which are the same as iLevels, but with the addition of a recommended interval duration (we’re not too sure why these need different names!).
The image below shoes some example iLevels/Optimised Intervals. The training zones below FTP are effectively the same as the seven zone system presented above (i.e. expressed as a percentage of FTP), except that an additional ‘Sweetspot’ zone has been added, spanning the upper end of Zone 3 and the lower end of Zone 4 in the seven zone model. Above FTP, the zones are derived from the power-duration model rather than FTP, and therefore will likely be different even for individuals with the same FTP.

The terminology used by WKO is a little tricky, especially because they tend to come up with their own terminology for concepts that already have standardised names. So to explain, the FRC/FTP level is one that’s designed to develop VO2max. The FRC and Pmax/FRC levels are both designed to develop anaerobic fitness, with the former being slightly lower intensity and longer intervals that would be more suited to developing anaerobic stamina, and the latter being more suited to developing anaerobic power (i.e. the maximum rate of anaerobic energy generation). For more on this, see here. Finally the Pmax zone is akin to the neuromuscular zone in the seven zone model.
The INSCYD model uses a similar method where power data from a series of maximal efforts of differing durations is used to derive various physiological attributes, and training intensity zones as shown below.

In terms of the intended purpose/physiological adaptations, most of these zones correspond to the zones in the classic seven zone model described in Section 1.
Zones 1, 2 and 3 in the INSCYD model (‘recovery’, ‘base’ and ‘medio’) correspond to Zones 1, 2 and 3 in the seven zone model (‘active recovery’, ‘extensive endurance’, ‘intensive endurance’).
Zones 5, 6 and 7 in the INSCYD model (‘anaerobic threshold’, ‘aerobic maximum’ and ‘high anaerobic’) correspond to Zones 4, 5 and 6 in the seven zone model (‘lactate threshold’, ‘VO2max’ and ‘VLamax’).
INSCYD also helpfully defines two extra zones, which (as you may have noticed) overlap with the 6 zones above. The FATmax zone, as described above, is the zone that optimally stimulates fat oxidation.
The lactate shuttling zone defines an upper and a lower power, where respective lactate accumulation and clearance rates are equal. This means you could design a set of intervals with a 1:1 work-recovery ratio and always be just about recovered for each work interval. This is thought to be a good way to work on lactate clearance abilities. The lower power target is also the power at which lactate clearance rates are maximised. Or in other words, this power tells us the optimal intensity to ride at in order to recover fastest.
In our experience, modelled training zones can work reasonably well provided that sufficient data is collected on maximal power outputs over a range of durations, and that this data is of a good quality (i.e. well paced, not influenced by factors such as fatigue, fuelling, hydration, motivation etc.). In practice, it’s hard to collect data of sufficient quality to model training zones with a high level of accuracy, and thus any training zones should only be taken as an approximate guide and not a precise prescription. Moreover, there are alternative approaches to help individualise the classic seven zone system that are cheaper and easier, and work just as well. These are discussed in our article on individualising training zones here.
In practice we tend not to bother with modelled training zones, as we find we have to tweak these anyway based on factors such as an athlete’s subjective sensations and heart rate. So we may as well start from the basic Coggan zones, and iterate from there.
Final Points
One outstanding question we haven’t yet addressed is whether you actually need to use training zones. They are helpful, but balanced training can be achieved without them. Simply performing different maximal efforts over a variety of different durations on a routine basis can give you a good idea of what you can achieve and you can use this to establish what is “easy”, “medium” or “hard”. Overall though, we feel that the use of training zones is a useful tool to help design training and to understand the likely physiological impacts of a particular training session.
As should now be clear, there is a need to individualise training zones. Even if you don’t have access to software or lab testing to help with this, there are a range of field-based methods you can use to verify your training zones are set correctly and ensure you’re not under or over-training when performing intervals above FTP. We have written an article with some practical tips to help with this here.
Get Fast, Faster:

Free Workout Library
Get your Key Workouts Guide; a free collection of 10 highly-effective, fundamental workouts you can use today to begin improving your endurance, threshold power, VO2max and other vital cycling abilities.
References
Allen, H., Coggan, A. R., & McGregor, S. (2019). Training and racing with a power meter. VeloPress.
Cerezuela-Espejo, V., Courel-Ibáñez, J., Morán-Navarro, R., Martínez-Cava, A., & Pallarés, J. G. (2018). The relationship between lactate and ventilatory thresholds in runners: Validity and reliability of exercise test performance parameters. Frontiers in physiology, 9, 1320.
Poole, D. C., Burnley, M., Vanhatalo, A., Rossiter, H. B., & Jones, A. M. (2016). Critical power: an important fatigue threshold in exercise physiology. Medicine and science in sports and exercise, 48(11), 2320.
Seiler, K. S., & Kjerland, G. Ø. (2006). Quantifying training intensity distribution in elite endurance athletes: is there evidence for an “optimal” distribution?. Scandinavian journal of medicine & science in sports, 16(1), 49-56.
Seiler, S., & Tønnessen, E. (2009). Intervals, thresholds, and long slow distance: the role of intensity and duration in endurance training. Sportscience, 13.
Vanhatalo, A., Jones, A. M., & Burnley, M. (2011). Application of critical power in sport. International journal of sports physiology and performance, 6(1), 128-136.